The Salesforce Reports is a list of records displayed in Salesforce in rows and columns and can be filtered grouped in a graphical chart. Folders are stored in folders. Folders can be public, hidden, or shared and set to a read-only file. Salesforce Reports tracking the sales and marketing efforts, ensuring the user is doing everything to boost the performance. Users will adjust the strategy with actionable data to identify new opportunities using the essential insights. It allows to visualize information and keep the teams working toward their targets. In addition, Salesforce constantly upgrades its products and offerings, allowing a visionary leader in the CRM space.
Today, in this blog, CloudVandana will share the five key features of Salesforce reports. They are an effective way to use data to visualize every element of marketing, sales, or service performance throughout the organization. In addition, the platform allows the user to combine data by time or any other metric.
Salesforce reports identify the best seller over a specific period, identify the best services, and satisfy customers in every interaction. It ensures that the marketing campaigns are drawing loyal customers.
When the reports and dashboards are defined correctly, it can fulfill all the business requirements.
Let’s have a look at the key features –
1. Additional Context Can Be Included With Data And Charts
Users can add text comments and calculation breakdowns to limit the display to a smaller data group to navigate deeper. The report focuses on types, owners, stages, and amounts with more detailed information.
2. Identify The KPIs
Before building reports and dashboards, every data point should be measured. Salesforce allows the user to configure the reports as per the unique business requirements. Users should consider these functionalities to provide pipeline prospects and customers, examine close ratios by month or quarter in operations, and finally offers charts that track each prospect through the organization’s customer journey. Salesforce helps the users collect and consolidate data from various sources to provide insights into the sales and marketing tasks and maintain daily operations. Reports make it easier to draw the entire team’s focus toward the same goal.
3. Updates All The Data Used In The Reports And Dashboards
Salesforce reports cleanse the data and ensure all the sources have updated information. It is considered the most essential step in implementing reports. All the duplicate data should be eliminated, track the users for updating relevant fields, and build data validation rules to keep the reports clear.
4. Continuous Revise And Upgraded
When a report is not working correctly and needs some improvement in the hiring process, the end-users will know. Sometimes, there might be a few variations in the data. The requirements are unique for different teams. Sometimes architectural changes are needed to provide newly discovered KPI measurements. Users should set their own goals to define the reporting criteria.
5. Data Science Approach
To solve an ethical business problem requires the user to format, sanitize, update and stage data. Users might need the help of data science tools such as machine learning and establishing the proper use cases to avail the maximum benefits of the business data.
Users can only on the collected information, making the initial report an essential step. With the help of Salesforce, users can develop new reports optimizing the visualizations to insert additional context as per requirements.
Are you looking for a registered Salesforce Consulting partner for a successful Salesforce implementation and maintenance? Please reach out to CloudVandana and get the full ROI of your Salesforce investment.

Digital Marketing Manager at Cloudvandana Solutions
Request a Free Consultation
YOU MIGHT ALSO LIKE
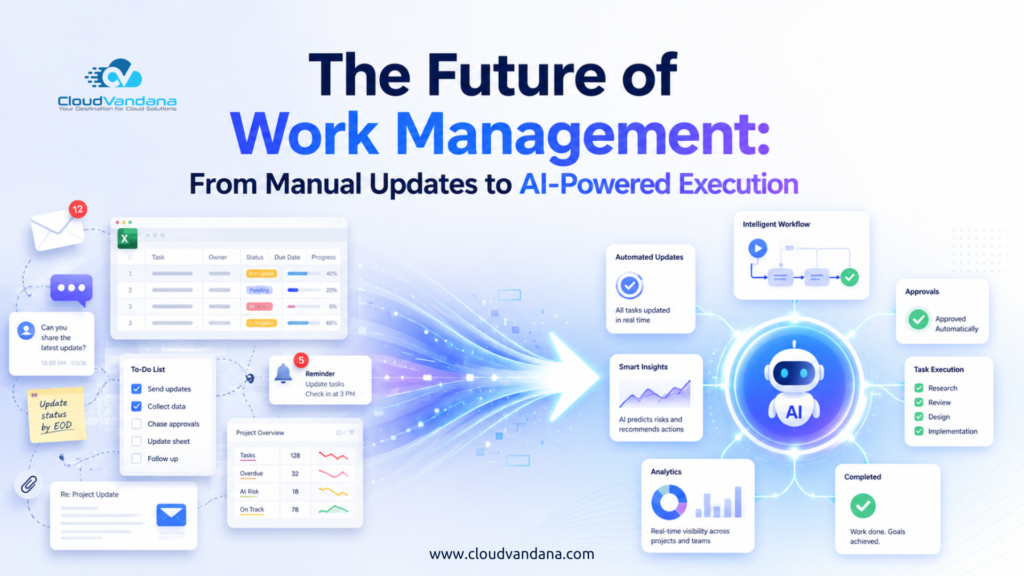
The Future of Work Management: From Manual Updates to AI-Powered Execution
Salesforce Implementation Checklist for Growing Businesses
Salesforce Health Check Checklist: 15 Things Every Business Should Review Quarterly

Salesforce Consulting Services: When Should a Business Hire an Expert?
Salesforce Automation vs AI Agents: What Should Businesses Use First?