Business intelligence tools are collections of tools and techniques that analyze and convert raw data into actionable and coherent information for use in business analysis to help in decision-making.
These tools are types of application software that can gather and analyze a large amount of unorganized data into useful information. They can organize data through key performance indicators, collaborative reports, interactive dashboards, and many more. Organizations can deduce actionable insights, set goals, and identify new growth opportunities with the help of data visualization and analytics available on the tools.
Business intelligence tools are in high demand for organizations looking to develop successful business models from the collected data. The tools provide two main features
- Data Analysis
- Data Visualization
Data Analysis tools integrate seamlessly into the existing database to extract relevant data. Data visualization presents data in pie graphs, flow charts, highlight tables, and stack columns, among others.
Let’s look at the effective business tools for data visualization.
1. Tableau
Tableau is the most used business intelligence tool. This tool offers a wide range of aesthetic graphical representations. The tool performs two key tasks, Data collection, and data analysis. Popular organizations worldwide are using this tool.
The features of this tool include automatic data updates, multipurpose dashboards, predictive analysis, community support, and many more.
2. PowerBI
PowerBI is a business intelligence tool that uses connectors with software to extract easy-to-understand insight from raw data. It is fully integrated with the Microsoft ecosystem that includes Azure, Office 365, Dynamic 365, and many more.
This tool is known for the easy handling of data and excellent modeling capabilities. In addition, collaborative workspaces can be created to share reports.
Features include data visualization, dataset filtration, online analytical processing, trend indicators, navigation pane, etc.
3. QlikSense
This tool was earlier known as QlikView. The tool offers seamless integration of the analytical back-end with a user-friendly front-end.
This tool allows the creation of interactive data visualizations, conducting detailed data analysis, building dashboards, and preparing informative reports.
Features include drop-data visualization, mobile analytics, securing enterprise-scale catalogs, geospatial analytics, timely alerts, etc.
4. DOMO
It is an essential business intelligence tool that offers complete data and visualization solutions. By integrating DOMO with the different data sources, businesses can track and create reports for different segments.
It offers pre-built visualization formats like heatmaps, column charts, scatter plots, and others. Extensive documentation and training are available for developers who use business intelligence software.
Features include data blending, report templates, multi-user support, responsive design, etc.
5. Sisense
It is another popular BI and data visualization tool that helps in collecting, analyzing, and visualizing databases. Data is centralized in this tool. This feature reduces the time of data processing time and allows for a combination of data from various sources.
Features include unlimited dashboards, seamless data integration, export data to Excel, CSV, PDF, etc.
Are you running short of time and resources? Partnering with the reputed staff augmentation company CloudVandana can bridge the gap and take you to the project goals. Schedule a call with CloudVandana today and hire the best team of remote developers for your organization. Call Us now.

Digital Marketing Manager at Cloudvandana Solutions
Request a Free Consultation
YOU MIGHT ALSO LIKE
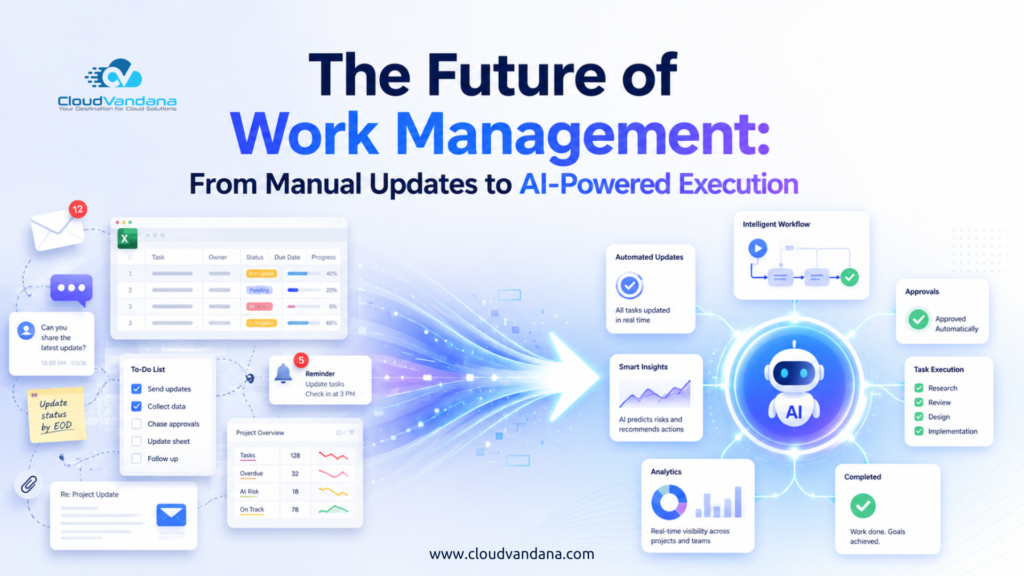
The Future of Work Management: From Manual Updates to AI-Powered Execution
Salesforce Implementation Checklist for Growing Businesses

Salesforce Health Check Checklist: 15 Things Every Business Should Review Quarterly

Salesforce Consulting Services: When Should a Business Hire an Expert?
Salesforce Automation vs AI Agents: What Should Businesses Use First?