Learn how to monitor key usage data for your system to boost performance, detect issues early, and make data-driven decisions. Discover best practices, metrics, tools, and expert strategies.
Introduction
In a world increasingly reliant on software systems, understanding how those systems are used has become a business imperative. Monitoring key usage data is no longer a luxury reserved for DevOps teams—it’s the nerve center of system performance, user satisfaction, and product evolution. Without visibility, you’re navigating blind.
What Is Usage Data?
Usage data refers to the digital breadcrumbs users leave behind when they interact with a system. It’s the amalgam of actions, patterns, transactions, and behaviors that form a real-time map of how the system is consumed.
This data can be structured (logins, feature clicks, API calls) or unstructured (logs, feedback, error messages). From user sessions to memory spikes, it all counts.
Why Monitoring Usage Data Matters
Operational Efficiency and Resource Allocation
By tracking usage, teams can identify which services are under- or over-utilized. You avoid over-provisioning infrastructure or ignoring underperforming modules. Efficiency becomes measurable.
Proactive Problem Detection and Resolution
Monitoring catches anomalies before they become outages. When a sudden spike in failed login attempts or database query times emerges, your alerting system should respond before your users do.
Product Improvement Through Behavioral Analytics
Usage data reveals what features people actually use—not what you think they use. This data validates hypotheses, shapes roadmaps, and refines UI/UX flows based on empirical evidence.
Strategic Decision-Making Driven by Real-World Usage
Executives can make informed decisions when backed by usage trends. Whether it’s prioritizing integrations or investing in mobile-first design, the data doesn’t lie.
Common Types of Usage Metrics to Monitor
User Session Frequency and Duration
Track how often users return and how long they stay. Frequent, long sessions indicate stickiness. Short, one-off logins might flag disengagement.
Feature Utilization Trends
Are your key features being ignored? Monitor button clicks, module accesses, and tool adoption over time to guide feature development.
System Load and Performance Bottlenecks
CPU, memory, bandwidth—monitor them all. These indicators highlight where the system is strained and when to scale.
Error Rates and Failure Patterns
5xx errors, failed API calls, form validation issues—these hidden failures degrade user trust and must be surfaced in real time.
Licensing and Quota Tracking
Track API limits, user entitlements, and storage usage. This data helps forecast renewals, upsells, or usage abuse.
Behavioral Analytics and User Journeys
Understanding not just what users do but how they move through your system gives unparalleled insight. Heatmaps, funnel tracking, and path analysis illuminate behavior patterns that static analytics miss.
Spot where users drop off, repeat actions, or fail to complete tasks. These friction points offer your highest ROI opportunities.
Real-Time vs. Historical Monitoring
Real-time monitoring is essential for live issues—think downtime, spikes, or security anomalies. Historical monitoring helps detect trends and seasonal patterns.
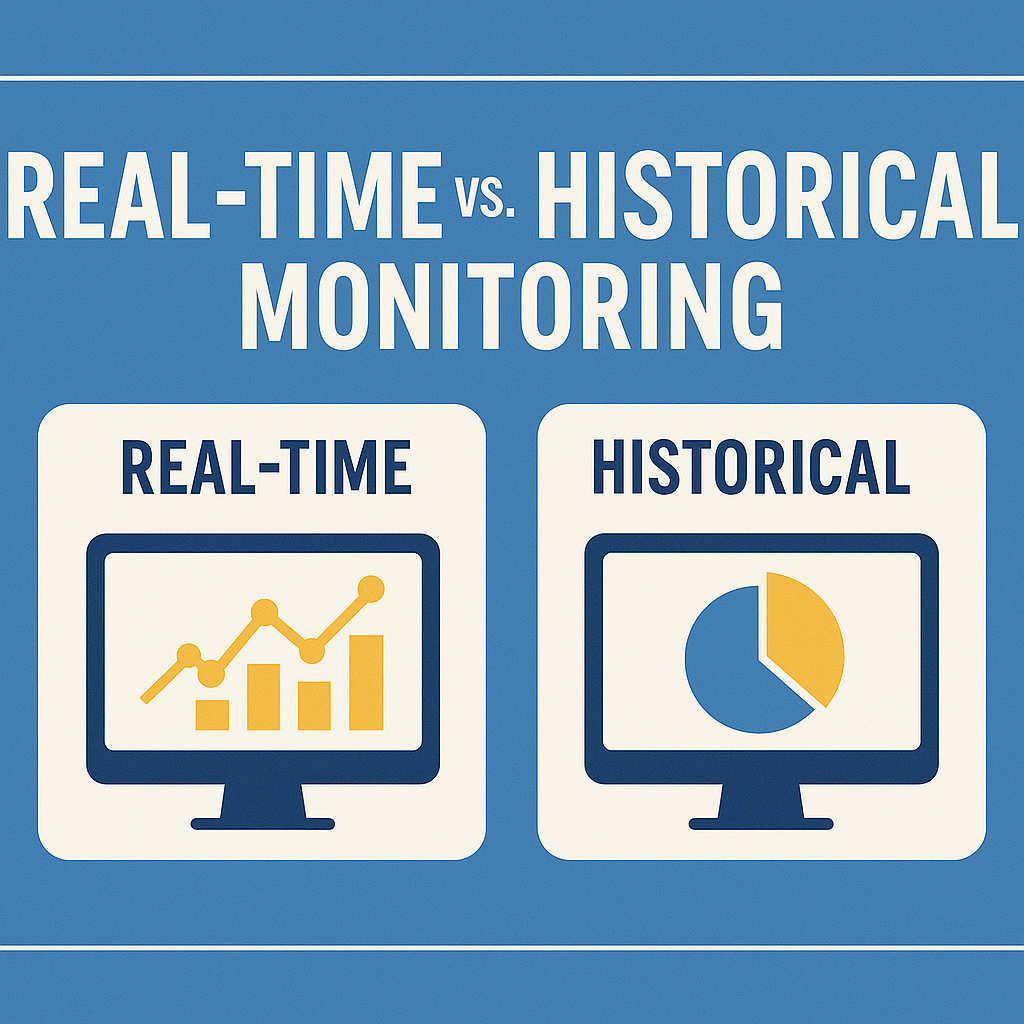
Use real-time to react. Use history to predict.
Tools for Monitoring Usage Data
Popular tools include:
- Salesforce reports for CRM systems
- Google Analytics for web properties
- New Relic / Datadog for application performance
- Mixpanel / Heap for behavioral analytics
- Custom telemetry pipelines for specialized tracking
Choose tools that align with your tech stack and business objectives.
KPIs and Benchmarks to Track
Every system has its critical KPIs:
- Response time under 300ms
- 99.99% uptime
- Churn rate below 3%
- Feature usage above 50% for new rollouts
Benchmark against past performance and industry peers.
Event Tracking and Instrumentation
Design your system to emit meaningful events. Log not just errors, but successes, time-on-task, and conditional behavior.
Structure events with context: user ID, timestamp, browser, API version. This detail transforms logs into intelligence.
Alerts and Thresholds
Set smart thresholds for alerts—not just static limits, but dynamic, behavior-driven triggers. Use severity levels: critical, warning, info.
Avoid alert fatigue by tuning precision. An over-alerting system gets ignored.
Usage Data and Capacity Planning
Usage trends inform when to scale servers, upgrade databases, or adopt cloud elasticity. Capacity is no longer guesswork—it’s modeled on actual usage curves.
Compliance and Privacy in Usage Monitoring
Collect only what’s necessary. Anonymize where possible. Respect consent. Stay compliant with:
- GDPR: Right to be forgotten
- HIPAA: Medical data confidentiality
- CCPA: California consumer rights
Your data strategy should balance insight with integrity.
Visualizing Usage Data Effectively
Raw numbers are noise. Dashboards transform metrics into meaning.
Use:
- Time-series charts for trends
- Heatmaps for behavior flows
- Pie and bar charts for distribution
- Tables with conditional formatting for threshold alerts
Make your insights human-readable.
Cross-Team Benefits of Usage Data
- Product managers define feature value
- Developers prioritize refactors
- Support teams anticipate issues
- Executives measure adoption and ROI
One dataset, many interpretations.
Common Pitfalls and How to Avoid Them
- Over-tracking: Too much data muddies insights
- Under-tracking: Missed signals, blind spots
- Misreading correlation as causation: Users dropping out after a login error doesn’t mean the login caused it
- Ignoring null data: Silence can be a signal too
Be intentional. Be analytical.
Success Stories: Monitoring in Action
One fintech company noticed a 40% increase in failed API calls on Mondays. Investigation revealed a billing batch process overloading memory—something they couldn’t have discovered without usage tracking.
Another SaaS firm found that their most clicked feature was buried in a submenu. Repositioning it to the dashboard increased user engagement by 30%.
Integrating Usage Data with DevOps and ITSM
Feed logs and alerts into systems like Jira, ServiceNow, or PagerDuty. Use CI/CD tools like Jenkins or GitHub Actions to deploy based on real-time feedback loops.
Usage data isn’t just for dashboards—it’s a workflow input.
Feedback Loops and Continuous Improvement
Usage monitoring is central to agile development. Sprint retrospectives fueled by data yield faster iteration and fewer assumptions.
Usage data isn’t static—it should evolve as the product evolves.
Future Trends in Usage Monitoring
- AI-driven insights: Predict issues before they occur
- Autonomous observability: Systems that self-heal or self-optimize
- Digital twins: Mirror systems for scenario testing based on real usage
- Unified telemetry: Combining logs, traces, and metrics under one framework
The monitoring of tomorrow is adaptive, not reactive.
Conclusion
Usage data is no longer just a backend concern—it’s the lifeblood of intelligent systems. Whether you’re chasing uptime, product-market fit, or user delight, monitoring key usage data gives you the visibility to lead with clarity.
With the right strategy and tooling, data moves from a passive archive to an active engine of growth.
Get Strategic Insights with CloudVandana
At CloudVandana, we help enterprises turn raw usage data into strategic gold. Whether you need to build custom dashboards, optimize tracking events, or integrate monitoring into your DevOps pipeline—we architect systems that reveal what truly matters.
Let us help you unlock actionable intelligence from your usage patterns.
👉 Explore our Monitoring & Analytics Services and ensure your system performs at its smartest, safest, and most scalable.
Ask ChatGPT

Digital Marketing Manager at Cloudvandana Solutions
Request a Free Consultation
YOU MIGHT ALSO LIKE

Why CRM Success Depends More on Process Than Software
The Future of Work Management: From Manual Updates to AI-Powered Execution
Salesforce Implementation Checklist for Growing Businesses
Salesforce Health Check Checklist: 15 Things Every Business Should Review Quarterly

Salesforce Consulting Services: When Should a Business Hire an Expert?