Learn how to add dynamic values to text in Einstein Analytics dashboards without using code. Boost clarity, personalization, and storytelling with this complete guide from CloudVandana.
Modern business users don’t just want dashboards—they demand smart dashboards. Dashboards that don’t just display static metrics but evolve in real-time, respond to filters, and surface insights dynamically. In the Salesforce ecosystem, Einstein Analytics (now part of CRM Analytics) enables precisely that.
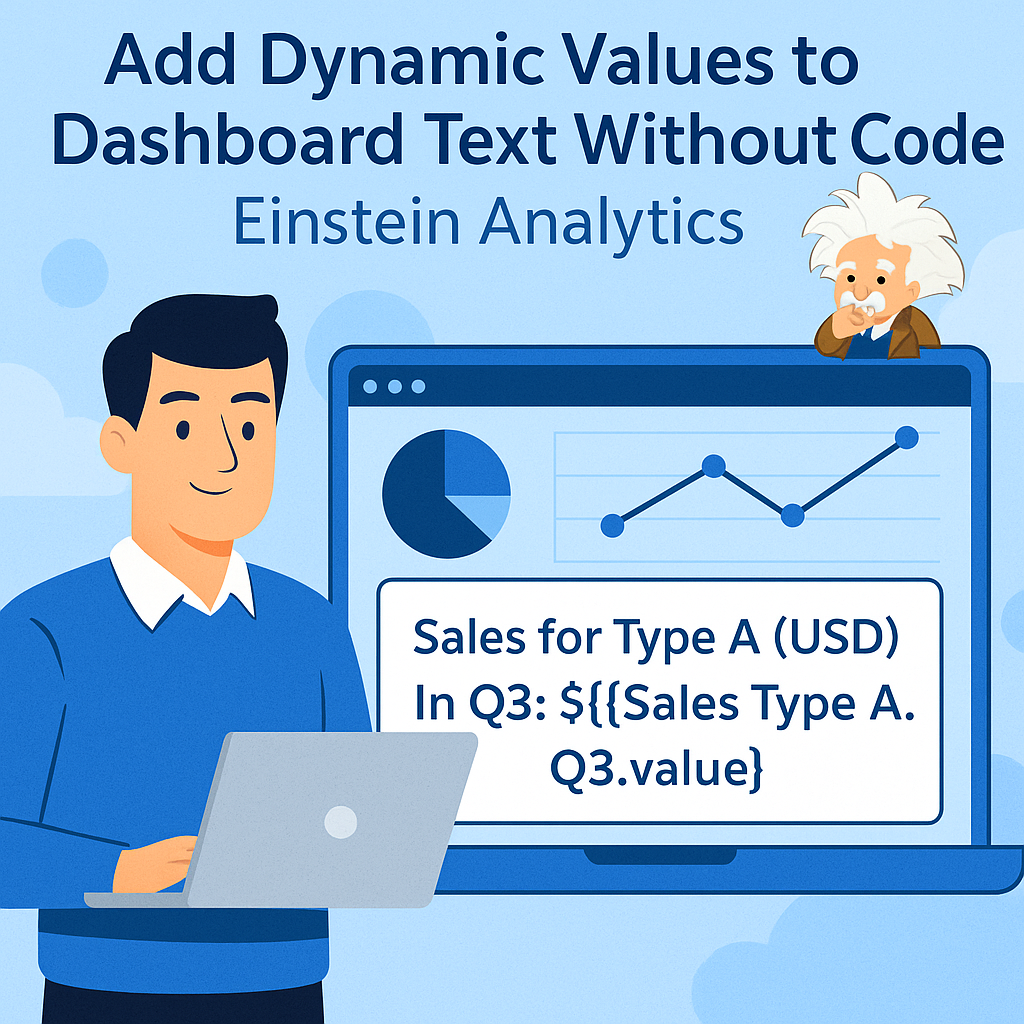
One of the most underutilized yet powerful features of Einstein Analytics is the ability to add dynamic values to dashboard text—without writing any code.
This guide explores how to deliver personalized, context-aware dashboard text using declarative tools in Einstein Analytics. Whether you’re building an executive summary dashboard or a sales performance tracker, mastering this technique will drastically elevate the clarity and storytelling power of your dashboards.
1. What Is Einstein Analytics?
Einstein Analytics—now known as CRM Analytics—is Salesforce’s advanced analytics and business intelligence platform. It goes beyond traditional reports by offering customizable dashboards, machine learning-powered predictions, and highly visual data storytelling tools.
2. The Role of Text Widgets in Dashboards
In any dashboard, text widgets are crucial for context. Whether you’re highlighting a top performer, displaying a date range, or calling out anomalies, the text element is how you communicate meaning—not just metrics.
3. Why Dynamic Text Matters
Static text is fine when nothing changes. But in real-world scenarios:
- Filters change
- Users personalize views
- Datasets evolve
Dynamic text ensures the dashboard narrative adapts in real-time—adding clarity, personalization, and interactivity.
4. Dynamic Text vs. Static Text: Key Differences
| Feature | Static Text | Dynamic Text |
|---|---|---|
| Updates with filters | ❌ | ✅ |
| Custom per user | ❌ | ✅ |
| Needs code | ❌ | ❌ (declarative possible) |
| Drives engagement | 🚫 | ✅ |
Dynamic text tells a living story—static text is just a caption.
5. Traditional Methods: Code-Based Binding
Before the no-code improvements, dynamic values required:
- SAQL or JSON-based bindings
- Complex syntax with curly braces
- Debugging through preview mode
While powerful, these methods demanded deep technical expertise and were prone to user error.
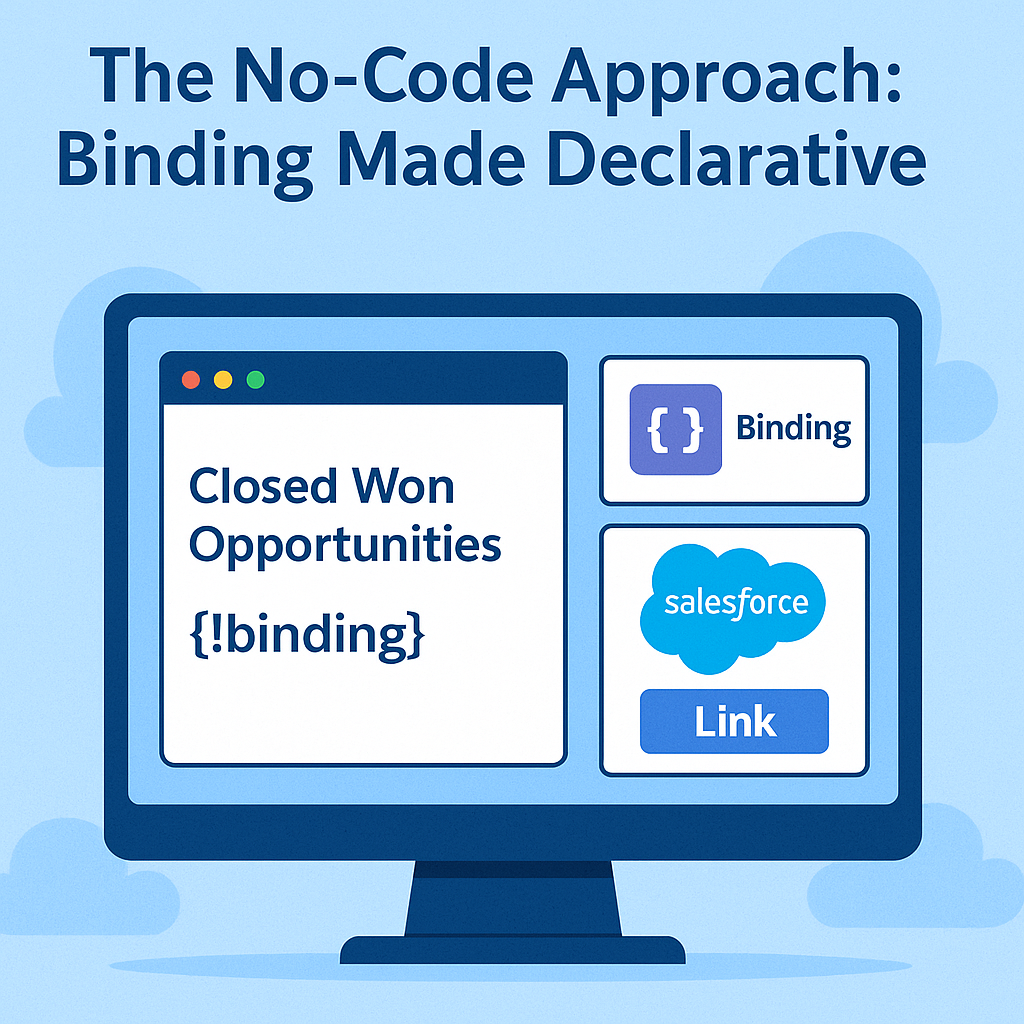
6. The No-Code Approach: Binding Made Declarative
Salesforce introduced enhanced text widgets that let you bind data directly—without touching a single line of code.
This innovation allows any admin or analyst to insert variables into text using:
- {{widget name.value}}
- {{interaction name.selection}}
It’s as simple as writing a sentence with dynamic placeholders.
7. Prerequisites Before You Begin
Make sure:
- You have Edit permissions for the dashboard
- Dataset and charts are already built
- Interaction names and widget IDs are meaningful
- You’re using the latest Dashboard Designer
8. Step-by-Step: Add Dynamic Text Without Code
Step 1: Open Dashboard in Edit Mode
Navigate to CRM Analytics > Dashboards > [Your Dashboard] > Click Edit
Step 2: Drag a Text Widget
From the component panel, drop a Text Widget onto the canvas
Step 3: Insert Text with Dynamic Variables
Click inside the text box and type something like:Top performing region this month is: {{topRegion.value}}
The variable topRegion must match the chart or selection’s Widget Name.
Step 4: Apply Filters (Optional)
If a filter is tied to the widget, the text will update when the filter value changes.
Step 5: Preview and Save
Click Preview to test it live, then Save your dashboard.
9. Supported Data Types and Bindings
You can bind to:
- Number widgets (
{{totalRevenue.value}}) - Selection widgets (
{{Region.selection}}) - Date filters (
{{selectedDate.selection}}) - Groupings from charts (
{{barChart.selection}})
These values update dynamically as users interact with the dashboard.
10. Using Filters to Drive Dynamic Text
Let’s say your dashboard has a Region Filter and a Top 5 Accounts Table. You can dynamically add text that says:
You're viewing performance for: {{RegionFilter.selection}}
The text will automatically change based on the user’s selection—no refresh needed.
11. Real-World Use Case: Sales Summary by Quarter
Scenario: A Sales Manager wants to view quarterly summaries dynamically.
Text Widget Example:In {{quarterFilter.selection}}, the total pipeline was ${{totalPipeline.value}} and the close rate was {{closeRate.value}}%.
This enables rapid decision-making without additional clicks.
12. Use Case: Executive Overview with KPI Highlights
Scenario: The CEO opens the dashboard weekly and wants key KPIs at a glance.
Text Widget Example:As of {{todayDate.value}}, our top-performing product is {{topProduct.value}}, contributing {{topProductShare.value}}% of total revenue.
Text transforms from passive label to active insight.
13. Use Case: Role-Based Messaging in Embedded Dashboards
Scenario: Embedded dashboard in Experience Cloud page for different partner types.
Use {{User.Role}} or widget-driven text to say:Welcome, {{userName}}. Here are your opportunities for {{partnerRegion.selection}}.
It creates hyper-personalized storytelling.
14. Tips for Cleaner Visual Communication
- Bold key numbers in your text
- Use headings to break up sections
- Avoid redundancy—don’t repeat chart titles
- Use variables within sentences for a natural tone
Good dashboards don’t just report—they converse.
15. Common Pitfalls and How to Avoid Them
| Issue | Solution |
|---|---|
| Variable doesn’t render | Check widget or filter name matches exactly |
| Text shows blank | Ensure a selection has been made |
| Numbers appear raw | Use Number Formatting in Widget settings |
| Too many variables | Keep messages focused; split across widgets if needed |
16. How This Enhances Data Literacy Across Teams
Dynamic text bridges the gap between technical charts and non-technical stakeholders. By summarizing key values in plain language, dashboards become narrative tools—not just data walls.
This empowers:
- Sales leaders to drive action
- Executives to understand context
- New users to navigate insights faster
17. Using Dynamic Text in Lightning App Pages
If your dashboard is embedded in a Lightning App Page:
- Dynamic values still apply
- You can combine them with standard page components
- Use filters and page context to control variables like
{{User.FullName}}
It enhances contextual awareness inside Salesforce records.
18. Maintaining Performance While Using Bindings
Dynamic text is lightweight, but poor widget naming or multiple nested selections can degrade performance.
Tips:
- Use simple widget names
- Avoid long chains of dependency
- Preview often during dashboard development
19. Limitations to Be Aware Of
- No support for conditional logic (e.g., IF statements) without JSON
- Can’t calculate inline (e.g., 100 – {{value}}) in plain text
- Limited formatting (no rich HTML styles inside variables)
- Not available in legacy dashboard designer
Despite these, the tradeoff for speed and simplicity is worth it in most use cases.
20. Future of Declarative Dashboard Building in Salesforce
Salesforce continues to invest in making analytics declarative-first. Expect upcoming releases to include:
- Conditional formatting in text
- Richer formula-based bindings
- AI-generated summaries using predictive widgets
Declarative analytics isn’t just a trend—it’s the new default.
FAQs
Q1. Can I use multiple dynamic values in one text widget?
Yes. You can include as many bindings as you need, e.g.,Top: {{rep1.value}}, Mid: {{rep2.value}}, Low: {{rep3.value}}
Q2. Will dynamic text work with embedded dashboards?
Absolutely. Whether in Lightning App Builder or Experience Cloud, dynamic text binds just like in the native view.
Q3. Can I apply conditional text (if/else) without code?
Not yet. Conditional logic still requires JSON-based bindings, but simpler cases may be achieved with creative widget structuring.
Final Thoughts and How CloudVandana Can Help
Adding dynamic values to dashboard text without code is a leap forward in democratizing analytics. No longer does rich, personalized data storytelling require technical expertise. Whether you’re building dashboards for executives, operations teams, or external partners, dynamic text transforms the user experience from passive observation to active insight.
At CloudVandana, we help organizations design Einstein Analytics dashboards that not only look good—but speak clearly. From dataset design to dynamic binding strategy, our certified experts will help you turn raw data into real-time intelligence.
📊 Ready to build dashboards that communicate like people do?
👉 Turn Your Dashboards Into Decision-Making Powerhouses with CloudVandana – Let’s Build Smarter, Faster, and More Dynamic Together!

Digital Marketing Manager at Cloudvandana Solutions
Request a Free Consultation
YOU MIGHT ALSO LIKE
Salesforce Implementation Checklist for Growing Businesses

Salesforce Health Check Checklist: 15 Things Every Business Should Review Quarterly

Salesforce Consulting Services: When Should a Business Hire an Expert?

Salesforce Automation vs AI Agents: What Should Businesses Use First?

Data Cloud, Agentforce, and AI CRM: What Businesses Need to Prepare First